
The Dalai Lama asked Paul Ekman and Stamen Design to design him an Atlas of Emotions. This online interactive project visualizes what science knows about emotions, emotional states, triggers,...
-
 View projectAfter Hawaii’s worst wildfire killed scores of people in August 2023, local and federal agencies were reckoning with the toxic chemicals created when a built environment burns. Reuters visually...
 -
 View projectA blockchain is a database that is shared across a network of computers. Once a record has been added to the chain it is very difficult to change. To ensure all the copies of the database are...
 -
 View projectDuring the early part of 2012, the City of Oakland's mayor Jean Quan was claiming that 90 percent of the city's homicides and shootings occurred in 100 of the city's 6,560 blocks, and that a plan...
 -
 View projectThis project visualizes the HSBC World Rugby SVNS 2024/2025 Men’s Standings after the Dubai and Cape Town events, using R (ggplot2) and Figma. The radial bar chart represents accumulated points for...
 -
 View projectTo celebrate the 50th anniversary of the most giant leap for mankind, we visualise all the missions to the Moon.
 -
 View projectOver the past four days, a mix of politicians and other figures — athletes, actors, business people and the like — delivered 73 speeches as part of the Republican National Convention. We tracked...
 -
 View projectThere were some graphics going around that showed the total amount of time spent during an average person’s lifetime doing things. The numbers were pretty rough though. For example, to calculate...
 -
 View projectCyberattacks are increasingly threatening industries and sectors in the wake of the Covid-19 pandemic. The consequences of cyberattacks can be severe and lasting, causing disruptions to the supply...
 -
 View projectKobe Bryant's 30,699th and final field goal came from 19 feet with 31 seconds left against the Utah Jazz. During his 20 years with the Lakers, he fired up more than 30,000 shots, including the...
 -
 View projectThe Star Wars movie universe is one of the most successful franchises of all time and a multigenerational classic. These films are loved by millions of dedicated fans and have been an iconic symbol...
 -
 View projectData Dance Movement is a response to Asian hate incidents and bystander intervention mainly related to Covid-19. In this design research project, I collected qualitative information through...
 -
 View projectThe visualisation was created to highlight the social impact building up to Kate Middleton's and Prince Williams Royal wedding. The visualisations have a simple, clean and clear style that use...
 -
 View projectThe 2012 Xylem Value of Water Index is a nationwide poll of American voters detailing what they think should be done about the country's water crisis and who should pay for it. The key findings of...
 -
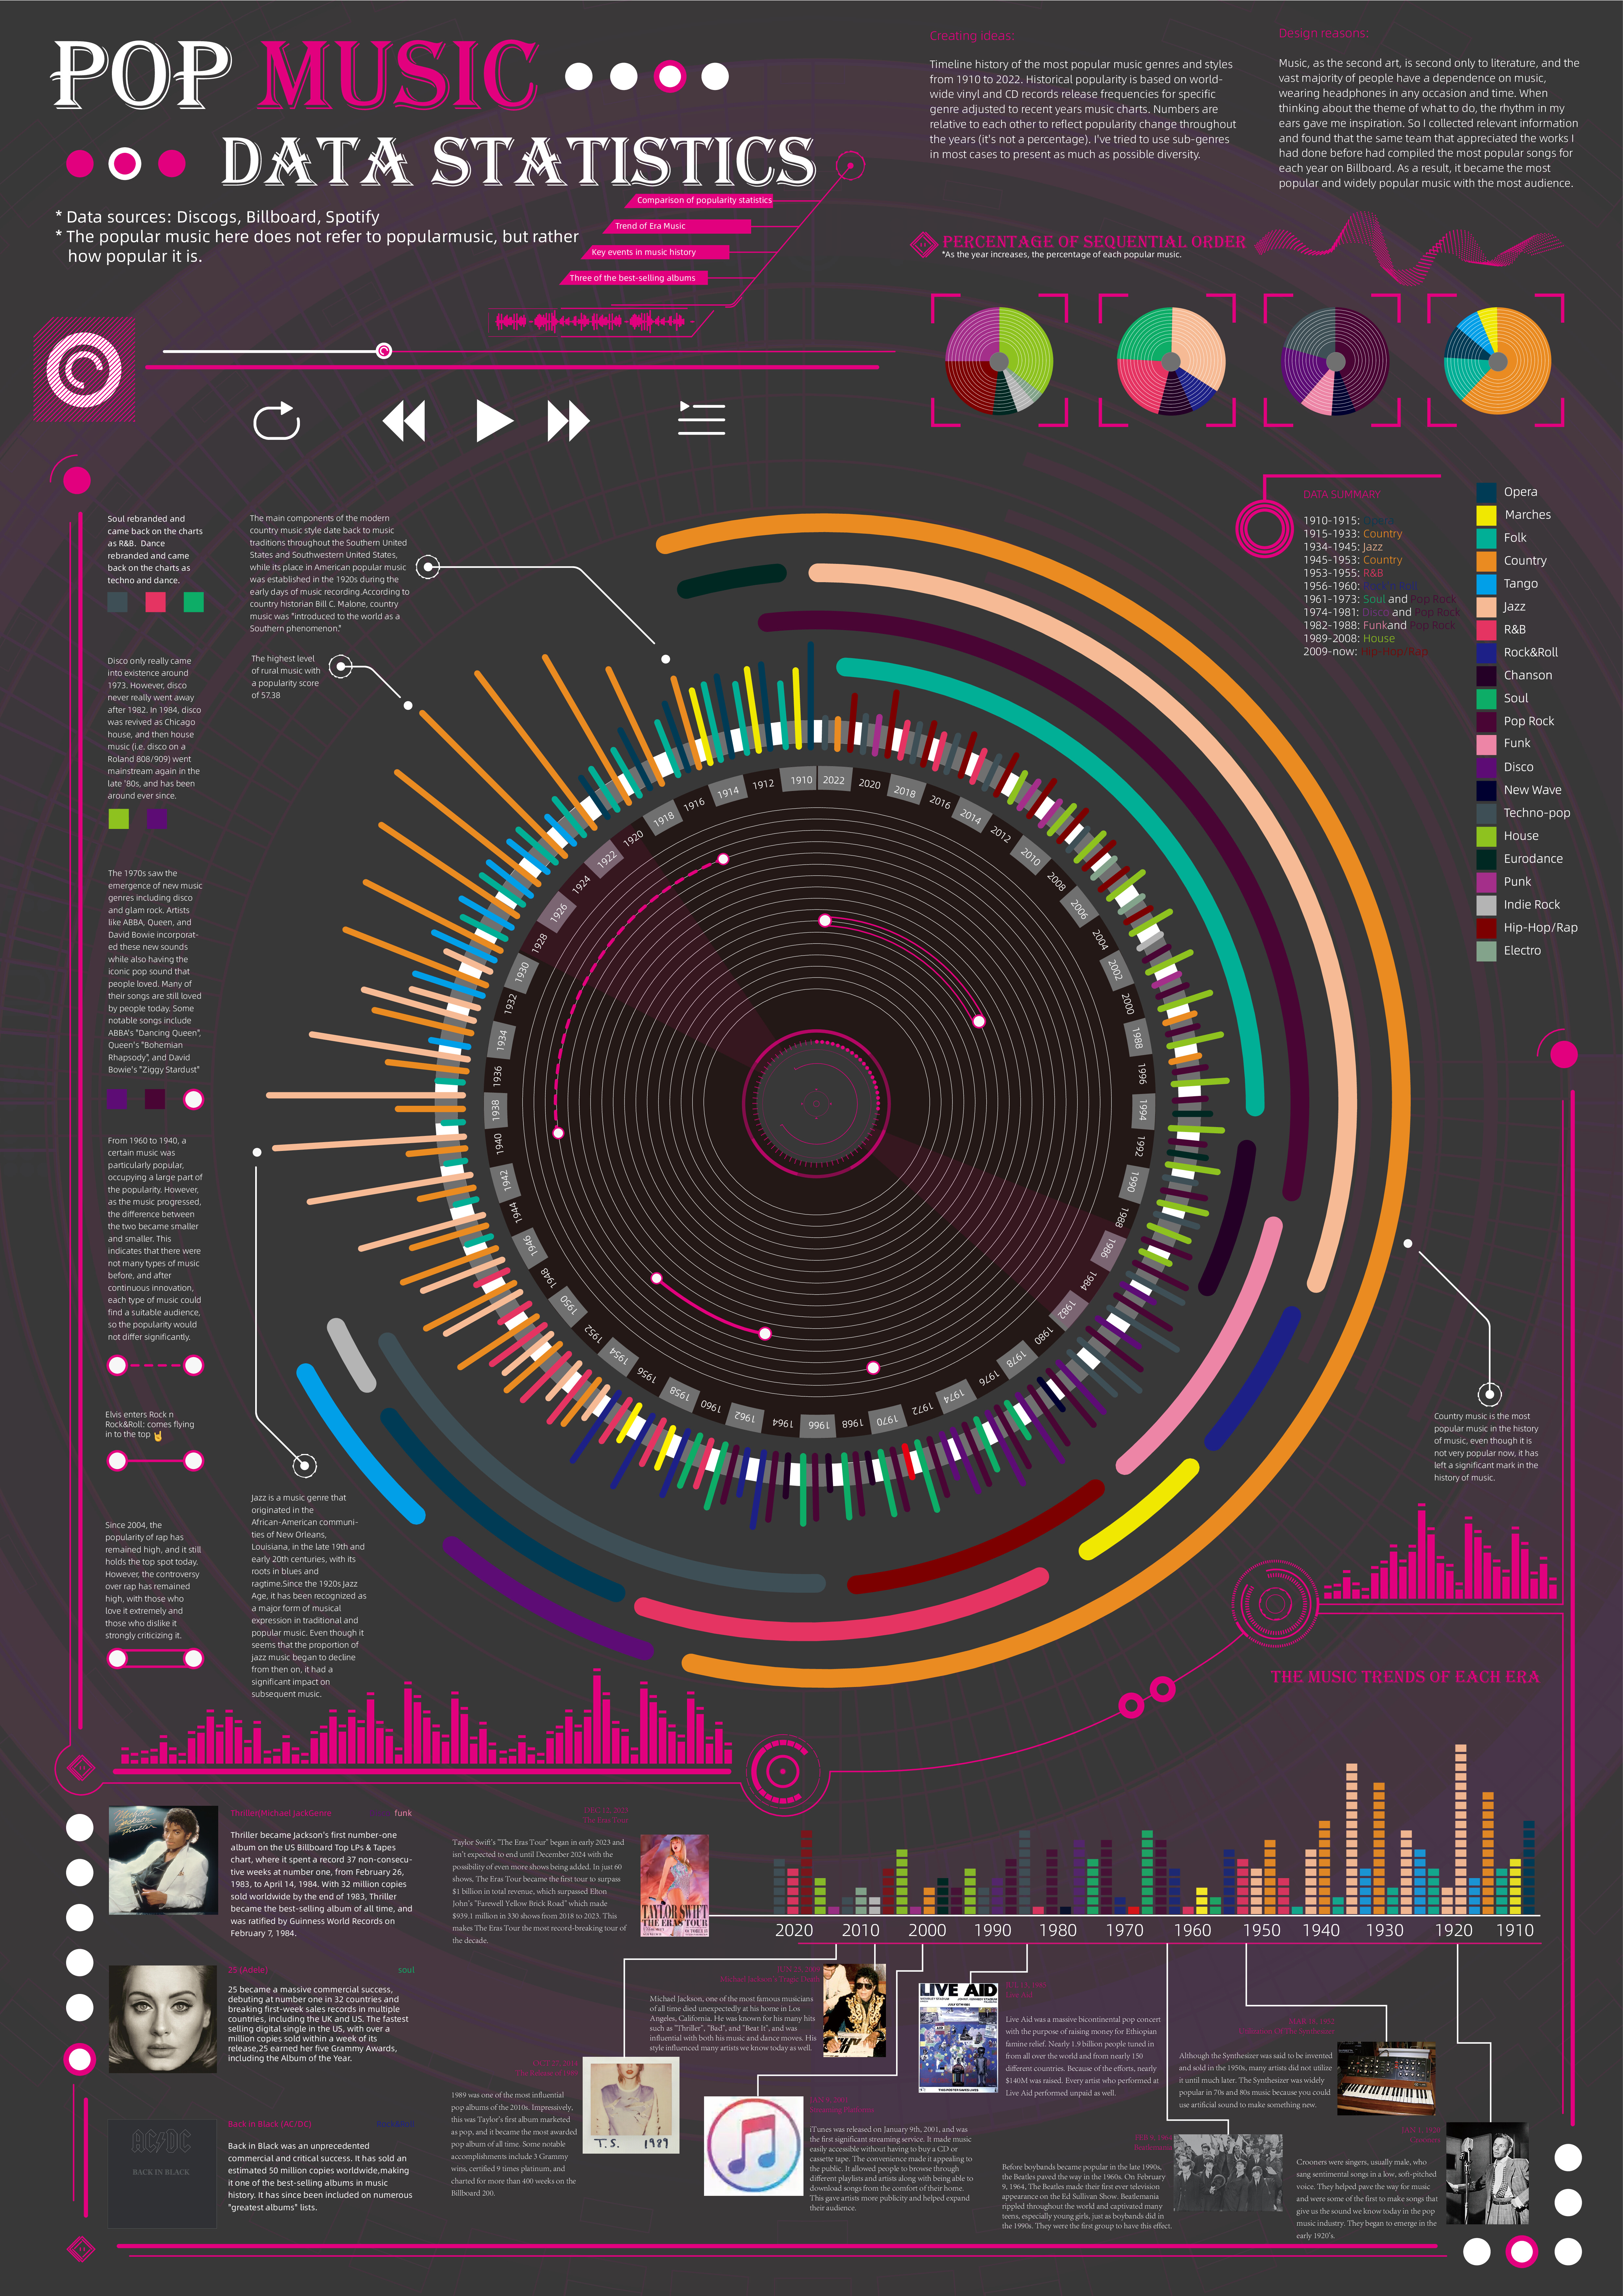
 View projectTimeline history of the most popular music genres and stylesfrom 1910 to 2022.Historical popularityis based on world-wide vinyl and CD records release frequencies for specificgenre adjusted to...
 -
 View projectThe Delayed Gratification team (www.slow-journalism.com) loves to dive into sports data, and for our book An Answer For Everything we thought it would be fascinating to see how much athletes have...
 -
 View projectWhen it comes to sand mining, the Singapore government is often closed to scrutiny. As a result, it is often cast as a villain, guzzling sand from its neighbours while it grows bigger through...
 -
 View projectThis infographic provides a clear overview of the 2024 EU elections across all 27 member states. It highlights key details such as election dates, the number of MEPs to be elected, voting rules for...
 -
 View projectStar Wars Colors is a data visualization about the physical traits and basic information of the Star Wars characters, which were represented as a card game of Lightsabers. This dataviz has a data...
 -
 View projectIn December 2012, Chatham House published a major new report on the changing politics of natural resources. The report, Resources Futures, is the result of two years of research and analysis of 12...
 -
 View projectSeaborn is a Python visualization library based on matplotlib. It provides a high-level interface for drawing attractive statistical graphics.
 -
 View projectAn interactive data visualization piece of 173 maps and 63 charts that present the country's health infrastructure (hospital, hospital beds, number of doctors) at a microregional level for each of...
 -
 View projectAn interactive and exploratory data visualization of one month of my life. Data from multiple sources was combined to generate a single view demonstrating sleeping patterns, eating habits,...
 -
 View projectInspired by the SMH article "Casino buses in migrants who hope 'to live beyond their means"(Heath Aston; December 11, 2011), we created a series of map to show the influence of The Star casino on...
 -
 View projectA series of articles and graphics for BBC Future about the long view of humanity. Looking at populations and civilisation collapse. In the first article we want to get across the scale looking at...
 -
 View projectAn entire database made accessible on your phone. Complexity distilled down to a looping, explorable interactive that gives you both the big picture and the minute details. David Yanofsky, Quartz...
 -
 View projectFor years, the Romanian press has decried the nation’s portrayal as ‘the dump of Europe’. All types of waste, both legal and illegal, find their way into Romania via boats and trucks, often...
 -
 View projectDrawing on 10,000 videos from the internet, Network Effect explores the psychological impact of Internet use on humanity. The project contains 10,000 video clips, 10,000 spoken sentences, news,...
 -
 View projectIntersections of major roads have been given nicknames like “mixing bowl,” “spaghetti junction,” and “knot”—invoking images of tangled messes, but there's beauty in the chaos. Applying colors...
 -
 View projectSo you're turning 30 (or you've already turned 30, or you will one day turn 30), and you're saying to yourself, "I'm so excited!" but also "I'm so scared!" (a reference that, if you get, by the...