2016 Winners - Data Visualization
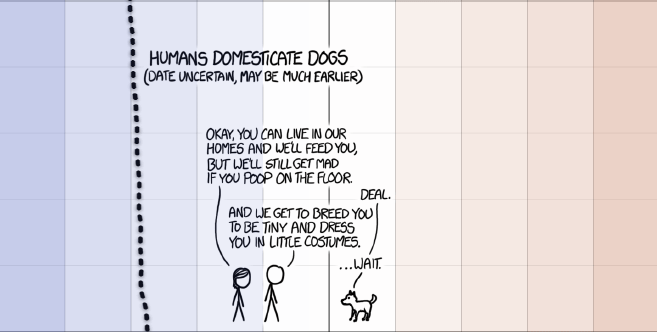
GOLD ($1,000) Earth Temperature Timeline by Randall Munroe of XKCD (USA)
A hand-drawn timeline of Earth's average temperature since the last ice age glaciation.
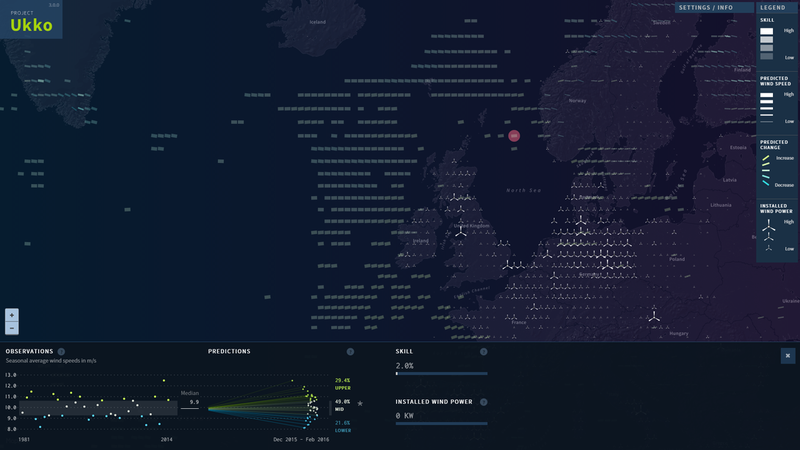
SILVER ($500) Project Ukko - Seasonal Wind Predictions by Moritz Stefaner (Germany)
Visualizing global wind conditions over the next few months.
BRONZE ($250) Gun Deaths in America by Ben Casselman, Matthew Conlen, Reuben Fischer-Baum for FiveThirtyEight (USA)
Detailing the demographics of America's gun death epidemic & its often surprising causes.
HONOURABLE MENTION Income Inequality in LA & Chicago by Herwig Scherabon (UK)
Visualizing income equality in two surreal & beautiful wooden prints.
:: View the winners of other categories: Data Journalism, Infographic, Dataviz Website, Dataviz Project, Interactive, & Special Awards.
:: Meet our expert judges.


